
In 2019, when we first released our research on 5 recruitment metrics you should use (but probably don’t), the world was a very different place. It was an applicant’s market, and recruiters had to work hard to win the best talent.
A year later, amidst a global pandemic that has fundamentally reshaped the way we work, these five recruitment metrics still matter (perhaps, even more than ever). OrganisationsOrganizations are freezing hiring, furloughing employees, ramping up recruitment – some are even doing all three. With many hiring teams working on a skeleton staff, the way forward can seem difficult.
These five measures of success can guide your recruitment strategy now and help you track its performance in the future. While recruitment metrics like time to fill or cost to fill tell you what’s happening, the ones we’ve identified are all about answering that ‘why’ question: they tell a behind-the-scenes story of what’s really happening with your organisationorganization’s recruitment in 2020.
Last year, we presented five recruitment metrics that deliver enormous value, but which are underutilisedunderutilized. In this post, we’ll revisit each metric and analyseanalyze how they’ve changed in the last year – and what that means for the future.
Recruitment metric #1: Offer acceptance rate
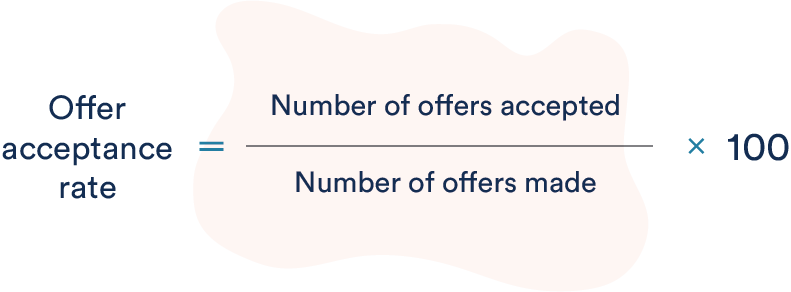
Why does it matter? Recruiting is expensive and each candidate that turns down a job offer costs your organisationorganization money. It may be a recruiter’s market at the moment with an oversupply of people looking for work – but are you really finding it easier to secure talent, and if not, why not? High-performing organisationsorganizations average a 99% offer acceptance rate each year, while the industry benchmark sits at 95% in 2020.
You go to a lot of effort to find ‘the one’ – the candidate that is the right fit for your organisationorganization. They’ve been screened, interviewed, tested and background checked. They have the skills, experience, attitude and cultural alignment that you want. But do they want to work for you? Tracking your offer acceptance rate will help you understand how you’re performing.
Our 2020 research found the average offer acceptance rate across all industries globally is 95% – which means for every 100 offers made, 95 people said “yes” and 5 said “no”. That’s down from 96% in 2019. To put this in comparison, top-performing organisationsorganizations average 99% each year. So, if your offer acceptance rate is less than 95% it’s worth considering why.
Offer acceptance rates vary between industries and companies. In Retail and Finance, the offer acceptance rate has dropped 3 percentage points and 2 percentage points respectively, year on year. This means more people are saying “no” to a job offer in 2020.
The likely reason for this is that uncertainty prevails. Jobseekers are feeling uncertain about the employment market and are putting their feelers out for multiple different roles. And candidates are unsure if it’s the right time to change roles, so they may be saying “yes” to an offer then rescinding their acceptance. We expect this to change on the other side of the COVID-19 crisis (all the more reason to track this recruitment metric now).
If your offer acceptance rate is below the industry benchmark, ask yourself:
- Are you an employer of choice?
- Is your compensation competitive?
- Did something happen during the recruitment process?
- Is your recruitment process fast enough to secure talent?
Recruitment metric #2: Applicant to hire rate
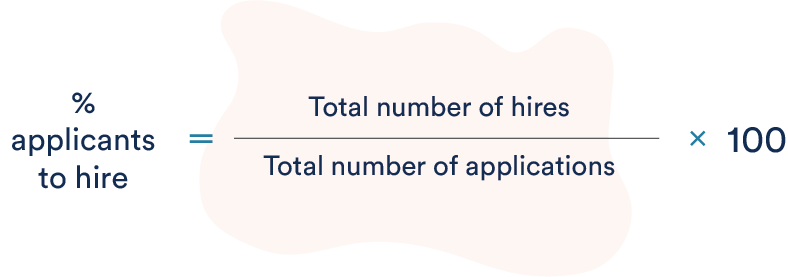
Why does your applicant to hire rate matter? This recruitment metric tells an important story about the effectiveness of your job listings. With more applicants on the market and applying for roles, you don’t want to be wading through more applications than necessary. Tracking applicant to hire rates can show whether job ads are targeted enough to reach and engage the right audience.
Our research tells us that in 2020, 4% of applicants across all industries are hired. This means for every 100 applications received, 4 people are hired (you can think of it as 1 out of every 25 applicants is hired). Globally, this has remained constant from last year, but per industry, the story is different.
Higher education has stayed steady at 7%, but retail and finance have both experienced a decrease in its applicants to hire rate from 4% in 2019 to 3% in 2020. This shows that each role is receiving more applicants.
What does this mean in light of COVID-19? During an economic contraction, there are fewer roles being advertised and high job losses. It’s likely that any job opening will attract more applicants. Many organisationsorganizations are not hiring right now – but when you open up the recruitment cycle again, what happens to that applicant-to-hire number?
If your application volumes are too high, your applicant to hire ratio will be lower. That can indicate your job ads are not targeted enough, you’re not using the most effective sourcing channels, or you need to revisit your sourcing methods. In order to get better-fit applicants:
- Work with hiring managers to understand the role requirements to create clearly defined job descriptions
- Create targeted job ads with clear role requirements
- Revisit your EVP and employer branding to ensure it aligns with your organisationorganization’s culture
- Identify and focus on effective sourcing channels and methods
The applicant-to-hire ratio is critical for organisationsorganizations to understand now and as the COVID-19 pandemic evolves. Remember it’s about quality, not quantity.
Recruitment metric #3: Candidates to hire rate
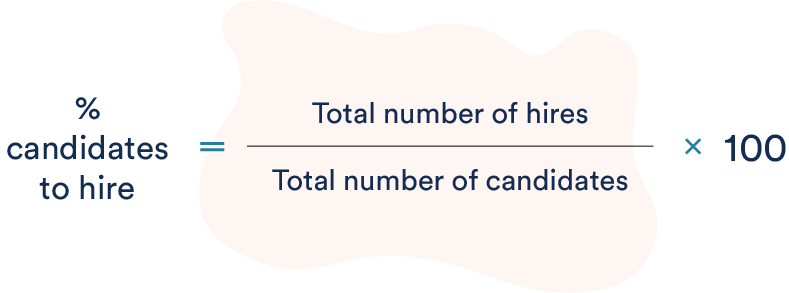
Why does your candidates to hire rate matter in 2021? With more talent applying for roles, it can be tempting to put more candidates through the hiring process. A lower % means recruiters are putting more candidates through to the hiring manager interview stage. Failing to track this recruitment metric can cost an organisationorganization hundreds of thousands of dollars in recruitment fees and negatively impact employer brand.
Our research has found that historically the average % candidates to hire sits at approximately 10%. In other words, one candidate out of 10 is hired which means 9 are told “no”.
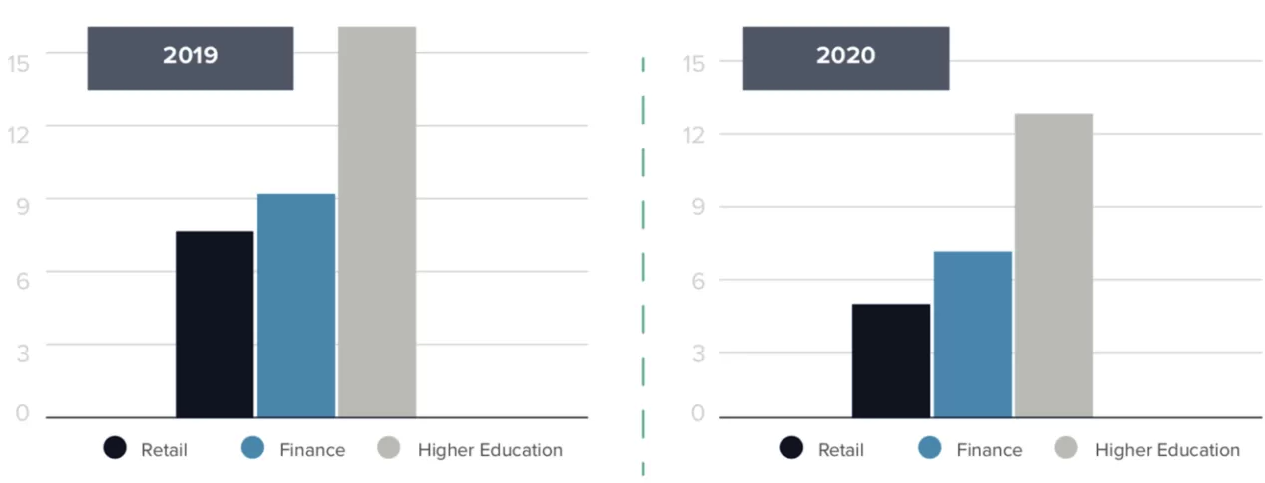
Globally, in 2020 the % of candidates to hire has fallen to 8% across all industries, or as a ratio, one out of 12.5 candidates are hired (23 out of 25 told no). Of course, this number varies industry to industry, with COVID-19 hitting some industries such as Retail particularly hard. The graphs below show Retail has fallen from 7% in 2019 to 5% in 2020. Finance fell from 9% in 2019 to 7% in 2020, while Higher Education fell the most, from 16% in 2019 to 13% in 2020.
The trend is understandable: with more people applying for roles, there’s a temptation to put more candidates through the recruitment funnel. But there are multiple issues with this approach:
- It’s costly and time-consuming for interviewers and hiring managers to screen and interview high volumes of candidates
- Keeping hiring managers engaged with the recruitment process becomes a challenge
- More candidates lengthens the recruitment process which runs the risk of losing talent to competitors
- You can damage your employer brand by providing a poor candidate experience
- There’s the potential to impact consumer brand – your candidates may also be your customers
Taking a large number of candidates through your recruitment process is obviously labourlabor-intensive and costly, and it can also mean you’re not engaging your silver medallist talent. Don’t forget to nurture warm talent pools and silver medallistmedalist candidates. This can be achieved with recruitment marketing – but it’s an area of talent acquisition that isn’t yet well-understood by many organisationsorganizations. Sitting at the top of the funnel, recruitment marketing has a vital role to play in today’s talent attraction landscape.
Recruitment metric #4: Sourcing channel effectiveness
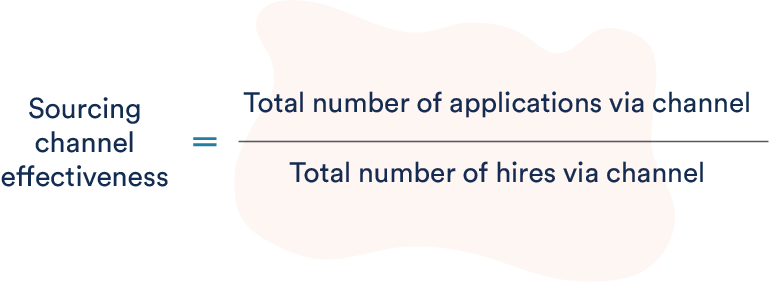
Why does sourcing channel effectiveness matter? Measuring sourcing channel effectiveness tells you which sourcing channels are working, and which need to be reconsidered. This can result in significant savings.
In a 2019 Harvard Business Review article, George W. Taylor Professor and Center for Human Resources Director, Peter Cappelli said, “few employers know which channel produces the best candidates at the lowest cost because they don’t track the outcomes.”
PageUp research has found that 54% of applications come via job boards, but these applications only lead to 17% of hires. Compare this to talent relationships: even though only 2% of applications come from talent pools, these applications account for a staggering 22% of a company’s overall hires. This means that talent relationships – in other words, talent pools – is 34X more effective than job boards in producing successful hires.
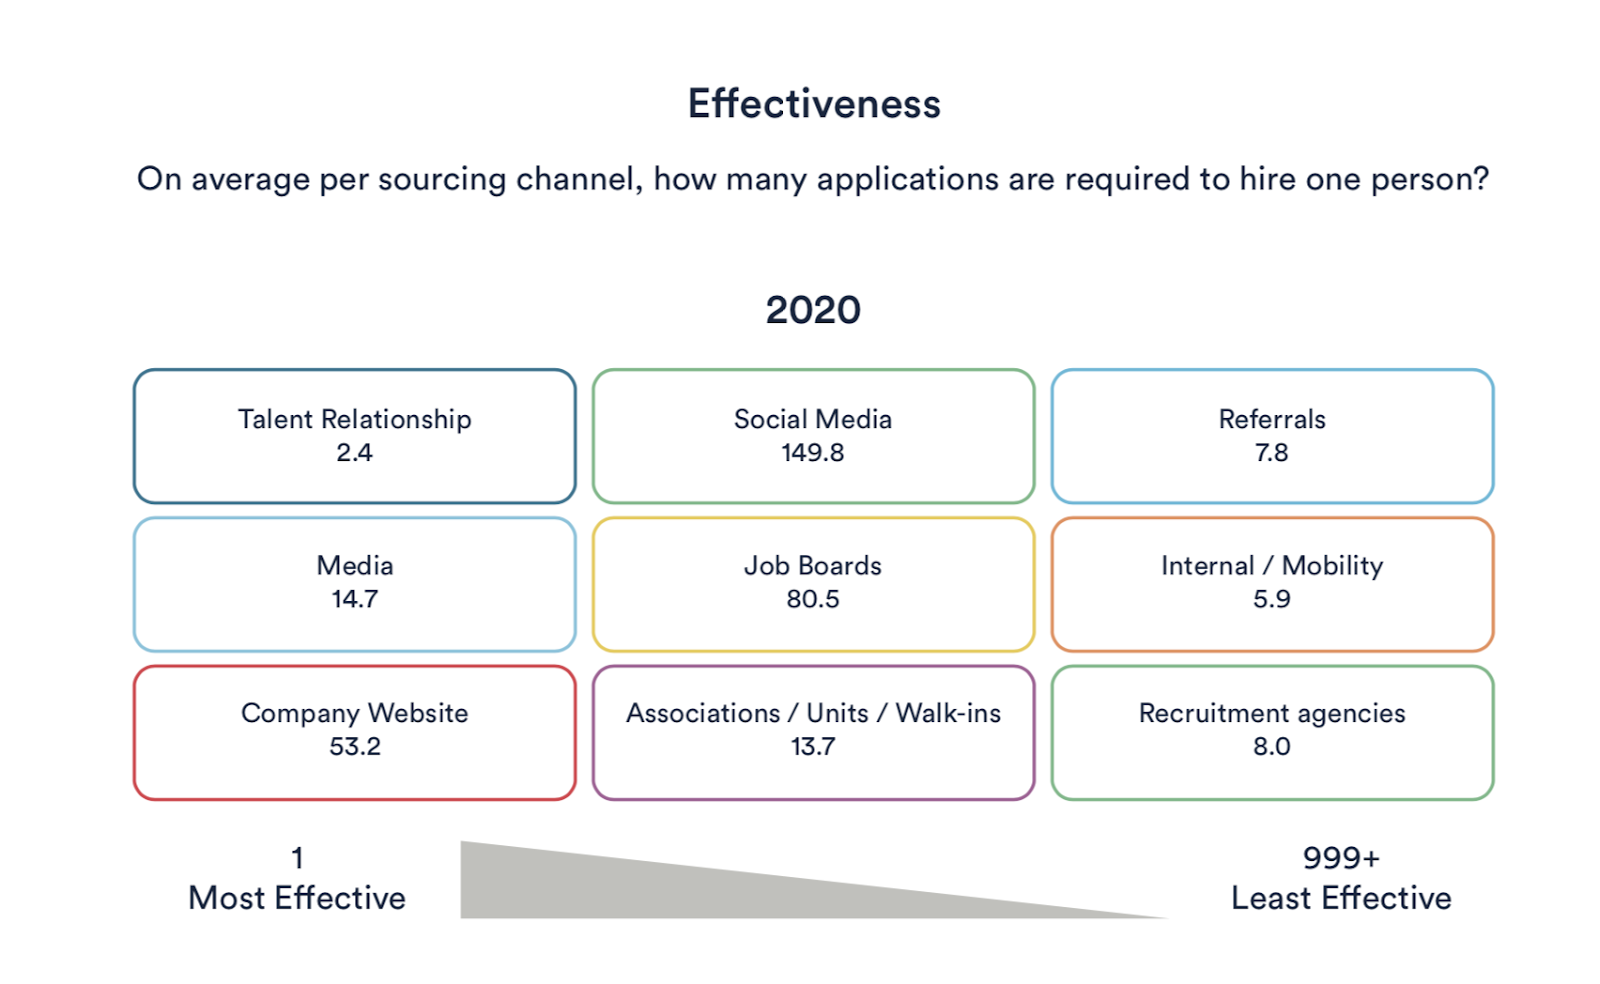
Comparing year on year, talent relationships has remained the highest-performing channel. It only takes 2.4 applications from talent pools to result in 1 hire.
Contrast that with social media, where in 2020 it takes almost 150 applications to result in 1 hire. Compared to 2019, the effectiveness of social media to produce hires is decreasing. But it’s a channel that gives free access to essentially millions of passive candidates, and targeted campaigns can still be incredibly powerful.
The proportion of applications via careers site increased in 2020, but the proportion of hires decreased: We can see year on year that it’s becoming a less effective sourcing channel. It takes 53 applications to secure a hire compared to 37 in 2019. If your careers site effectiveness has gone down since last year, this should be motivation for a careers site overhaul. Make sure you’re constantly tracking and optimisingoptimizing careers site content to ensure it’s appealing to candidates and is designed to convert visitors into applicants.
Internal mobility is a sourcing channel that has seen noticeable changes year on year. It now only requires 5.9 applications to result in 1 hire – down from 6.8 in 2019. This reflects what we’ve heard in the market – a number of organisationsorganizations have sought to redeploy their workforce internally rather than going out to market to hire.
Job boards have become noticeably less effective in producing hires in the last year. In 2019 it would take 68 applications to result in 1 hire – but in 2020 that number is just over 80 applications per hire. This may reflect the volume of applicants currently on the market, which has increased the number of ‘wrong fit’ applicants coming through more generalist channels such as social media and job boards.
Candidates who are coming through referrals, talent pools and internal mobility, by contrast, are already aligned to your business and what it’s trying to achieve, have largely been pre-vetted, and have already had the chance to self-select in or out of the recruitment process.
Do you know the effectiveness of your sourcing channels? Ask yourself:
- What are our main sourcing channels?
- Where do the most applicants come from?
- Where do the most hires come from?
- What is the cost per hire per channel?
- How should our sourcing channel strategy change based on this?
Recruitment metric #5: Mobile applications and time to apply rates
Why does it matter? With remote work becoming the new norm, the trend towards mobile adoption isn’t slowing down. Companies need to deliver consumer-grade recruitment journeys to speed up the application process and attract top talent.
Mobile applications and time to apply rates are two separate recruitment metrics, but they work together to tell a story that might otherwise be overlooked.
Are your mobile application and time to apply rates in line with industry standards? Ask yourself:
- Is your careers site mobile-optimisedoptimized?
- Do you offer applicants the opportunity to pre-fill from social sites/CVs?
- Are your job application forms suited to mobile usage?
Tips:
- Make application forms shorter
- Include screening questions so candidates can be moved through, or out, of the process quickly
- Try applying for a job using your own form: where can the process can be streamlined?
- Search for a role on your career website using a mobile – was the process easy?
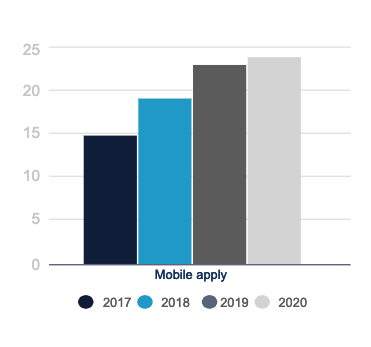
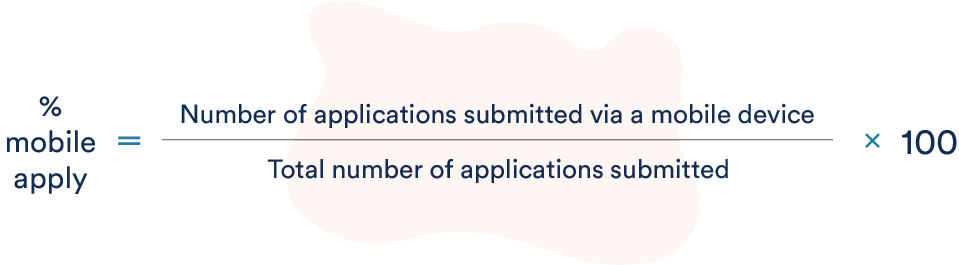
In the past year, 24% of applications were submitted via a mobile device, according to PageUp research. Last year, that number was 23%. That’s up from 15% at the end of 2017, and 19% in 2018.
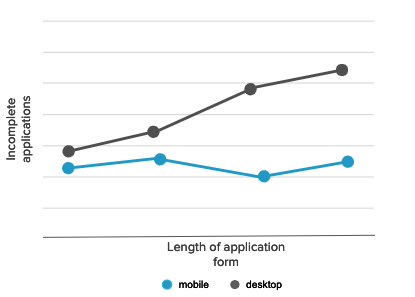
PageUp research has also found that there is a correlation between abandoned job applications and applications made on a mobile device. As the application form lengthens, the number of incomplete applications via mobile devices increases. Lengthy job applications become tedious on these devices, applicants give up and they don’t complete the application. This doesn’t happen as often on desktop – although lengthy application forms are not recommended on any device.
If you’re looking to optimiseoptimize your mobile recruitment approaches, make it simple and easy for jobseekers to apply on-the-go. Consider allowing candidates to attach their resume or autofill applications from their social media profiles.
Measure recruiting success with PageUp’s powerful platform
Knowing which recruitment metrics to track helps you identify the most effective ways to attract the best talent in a changing landscape. Learn more about how our powerful talent management technology can help you optimiseoptimize your recruitment approaches at pageuppeople.com
The post 5 recruitment metrics you should track in 2021 appeared first on PageUp.